🔍 Same and Different
fractionsmeasurement & data

Same & Different: Genre Graphs

Look at the two pictures below. What do you notice?

A. A pie chart with 4th Grader's favorite type of book genre. 1-half prefer graphic novels. 1-fourth prefer fantasy. 1-eighth prefer realistic fiction. 1-eighth prefer non-fiction. B. A pie chart with 5th grader's favorite type of book genre. 1-third prefer graphic novels. 1-third prefer fantasy. 1-sixth prefer realistic fiction. 1-sixth prefer non-fiction.

A key that shows the four book categories students prefer: graphic novels, fantasy, realistic fiction, and non-fiction.

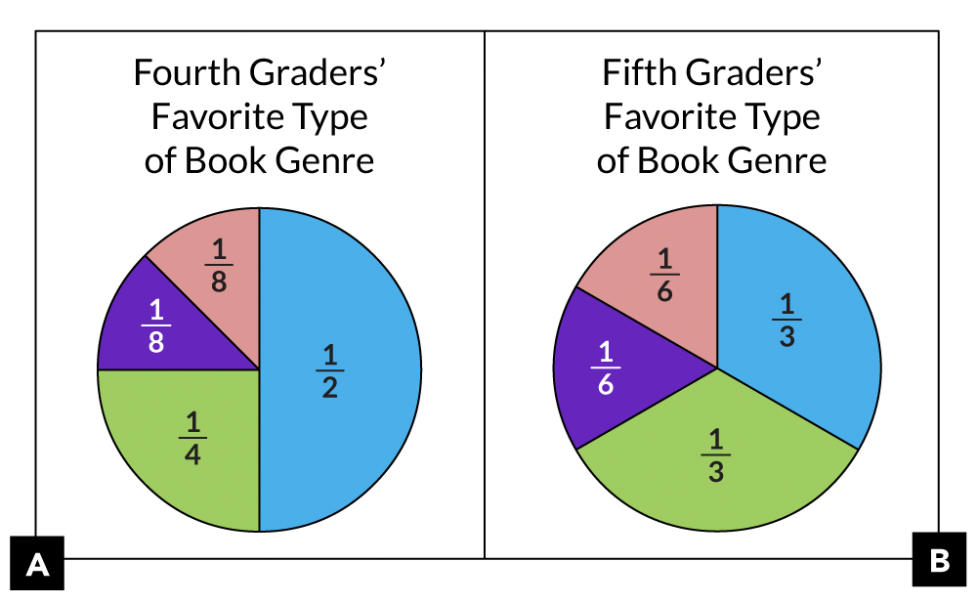
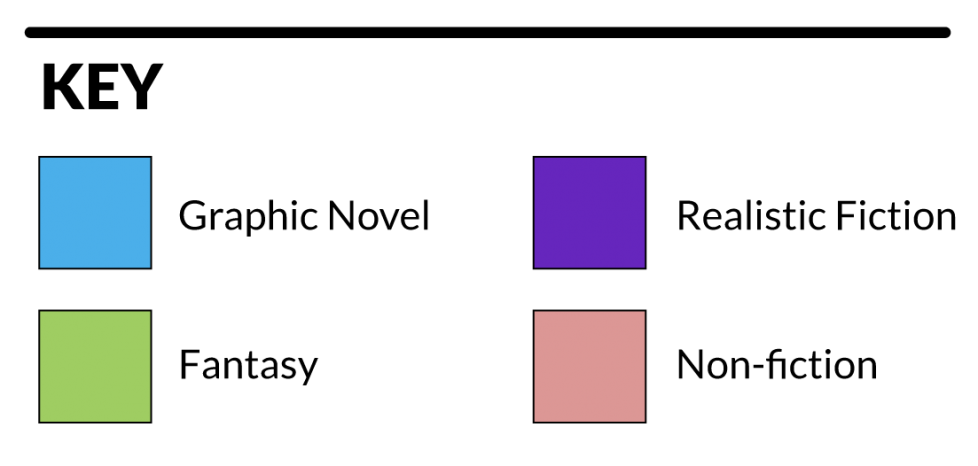
  1. How are pictures A and B mathematically the same, and how are they different?
  2. A and B are the same because …
  3. A and B are different because …
  4. Make a third circle graph labeled with fractional parts. Explain how your picture is the same as pictures A and B, and how it is different.

Printable Version

Reference for Educators

View Original Activity ↗ ← Back to Set